Clinical Trial Data Visualization Market Expanding with Cloud Adoption
The Business Research Company’s 2026 market reports feature enhanced tools like market attractiveness analysis, TAM assessment, and company scoring matrices, along with interactive dashboards, deeper supply chain insights, and startup coverage strengthening the depth, usability, and strategic value of insights.
By 2030, What Market Size Is The Clinical Trial Data Visualization Market Expected To Reach Based On Its 2026 Value?
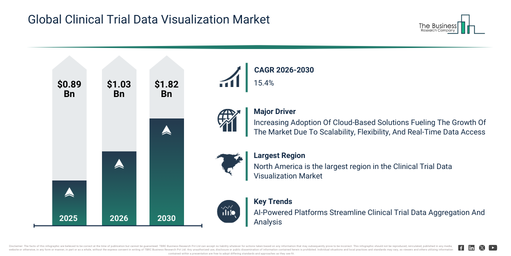
The clinical trial data visualization market has experienced substantial growth recently. This market is projected to expand from $0.89 billion in 2025 to $1.03 billion in 2026, exhibiting a compound annual growth rate (CAGR) of 15.7%. Historically, this expansion has been driven by factors such as the increasing intricacy of clinical trial data, the proliferation of multi-site global trials, heightened regulatory oversight, the widespread adoption of electronic data capture systems, and a rising imperative for quicker trial insights.
The clinical trial data visualization market is anticipated to experience substantial growth over the next few years. It is projected to reach $1.82 billion by 2030, demonstrating a compound annual growth rate (CAGR) of 15.4%. This expansion during the forecast period can be attributed to the increasing deployment of AI-driven data visualization, the enlargement of decentralized and hybrid trials, a rising demand for cloud-based analytics platforms, a growing emphasis on predictive trial analytics, and increased investment in data transparency tools. Prominent trends for the forecast period include the increasing incorporation of interactive trial dashboards, a rising use of advanced data analytics tools, a growing need for real-time trial monitoring, the expansion of visual risk detection capabilities, and an enhanced focus on the accuracy of regulatory reporting.
Access Your Free Sample Report For In-Depth Market Analysis:
What Major Factors Are Driving The Clinical Trial Data Visualization Market Forward?
Future expansion of the clinical trial data visualization market is anticipated to be driven by the growing integration of cloud-based solutions. These solutions are services delivered over the internet, providing remote access to computing capabilities, storage, and software applications, thereby removing the necessity for physical hardware or infrastructure on-site. Their growing popularity stems from their inherent scalability and flexibility, enabling organizations to readily modify resources as needed without incurring substantial initial infrastructure expenses. For clinical trial data visualization, cloud-based solutions improve the process by supplying platforms that are both scalable and easily reachable, making them particularly suitable for research teams spread across different locations. By enabling real-time data aggregation, analysis, and visualization, these solutions minimize manual data processing, which in turn boosts trial efficiency and supports better decision-making. An illustrative example is seen in December 2023, when Eurostat, a government agency located in Luxembourg, reported that in 2023, 42.5% of EU enterprises acquired cloud computing services primarily for uses like email, file storage, and office software. This figure indicated a 4.2-percentage-point increase from 2021. Consequently, the expanding use of cloud-based solutions is a key factor propelling the expansion of the clinical trial data visualization market.
Which Segment Types Are Examined In The Clinical Trial Data Visualization Market Segment Study?
The clinical trial data visualization market covered in this report is segmented –
1) By Component: Software, Services
2) By Deployment Mode: On-Premises, Cloud
3) By End-User: Pharmaceutical Companies, Biotechnology Companies, Contract Research Organizations, Academic And Government Research Institutes, Other End-Users
Subsegments:
1) By Software: Data Visualization Tools, Data Analytics Platforms, Reporting Dashboards
2) By Services: Data Management Services, Consulting Services, Training And Support Services
Which Trends Are Impacting The Progress Of The Clinical Trial Data Visualization Market?
Leading companies in the clinical trial data visualization market are concentrating on developing innovative solutions, such as artificial intelligence-powered data integration platforms, to optimize data collection, improve real-time understanding, and enhance decision-making within clinical trials. These Artificial Intelligence-powered data integration platforms are software systems that utilize AI to automatically gather, analyze, and standardize clinical trial data from various sources, enabling quicker and more precise insights. For instance, in June 2024, Medidata Solutions Inc., a US-based technology and life sciences company, unveiled Medidata Clinical Data Studio, an AI-driven data integration platform designed to transform the clinical trial data experience. This platform streamlines the aggregation, standardization, and review of clinical data, assisting study teams in reducing data review cycle times by up to 80% and decreasing patient profile review by 50%. It provides automated data ingestion and reconciliation, anomaly detection, risk-based quality management dashboards, and real-time collaborative insights, all within a single unified workspace, thereby improving data quality, minimizing risk, and accelerating trial execution.
Which Players Are Part Of The Competitive Landscape Of The Clinical Trial Data Visualization Market?
Major companies operating in the clinical trial data visualization market are ICON plc, Dassault Systèmes European Company, Oracle Corporation, Thermo Fisher Scientific Inc., IQVIA Inc., Syneos Health Inc., Veeva Systems Inc., Medpace Holdings Inc., Medidata Solutions, Signant Health, QlikTech International AB, ArisGlobal LLC, Rho Inc., YPrime LLC, Anju Software Inc., TriNetX LLC, Quanticate International Limited., Thread Research Inc., Spotfire LLC, Datacubed Health Inc., Castor EDC Inc., Clinion Healthcare Technologies Pvt. Ltd.
Get The Full Clinical Trial Data Visualization Market Report:
Which Region Dominates The Clinical Trial Data Visualization Market By Market Share?
North America was the largest region in the clinical trial data visualization market in 2025. Asia-Pacific is expected to be the fastest-growing region in the forecast period. The regions covered in the clinical trial data visualization market report are Asia-Pacific, South East Asia, Western Europe, Eastern Europe, North America, South America, Middle East, Africa.
Request A Customized Clinical Trial Data Visualization Market Report For Competitive Insights:
Browse Through More Reports Similar to the Global Clinical Trial Data Visualization Market 2026, By The Business Research Company
Clinical Trial Imaging Market Report 2026
https://www.thebusinessresearchcompany.com/report/clinical-trial-imaging-global-market-report
Biological Data Visualization Market Report 2026
https://www.thebusinessresearchcompany.com/report/biological-data-visualization-global-market-report
Data Visualization Tools Market Report 2026
https://www.thebusinessresearchcompany.com/report/data-visualization-tools-global-market-report
Get in touch with us:
The Business Research Company: https://www.thebusinessresearchcompany.com/
Americas +1 310-496-7795
Asia +44 7882 955267 & +91 8897263534
Europe +44 7882 955267
Email us at info@tbrc.info
Follow us on:
LinkedIn: https://in.linkedin.com/company/the-business-research-company
YouTube: https://www.youtube.com/channel/UC24_fI0rV8cR5DxlCpgmyFQ
Global Market Model: https://www.thebusinessresearchcompany.com/global-market-model